

The Challenge
The marketing department at a large holding company managed dozens of brands and campaigns across multiple digital channels.
Each week, junior account managers spent hours manually pulling performance data from Google Analytics, Facebook Ads, and Google Ads, compiling it into client-ready summaries.
Despite having Looker Studio dashboards, the team still lacked actionable understanding of what the data meant. The dashboards showed trends — but not context. Managers were left translating numbers into narratives, one client at a time.
The process was tedious, time-consuming, and error-prone. Reports often went out late, insights were inconsistent, and the growing number of brands made it impossible to scale without adding more staff.
What We Built
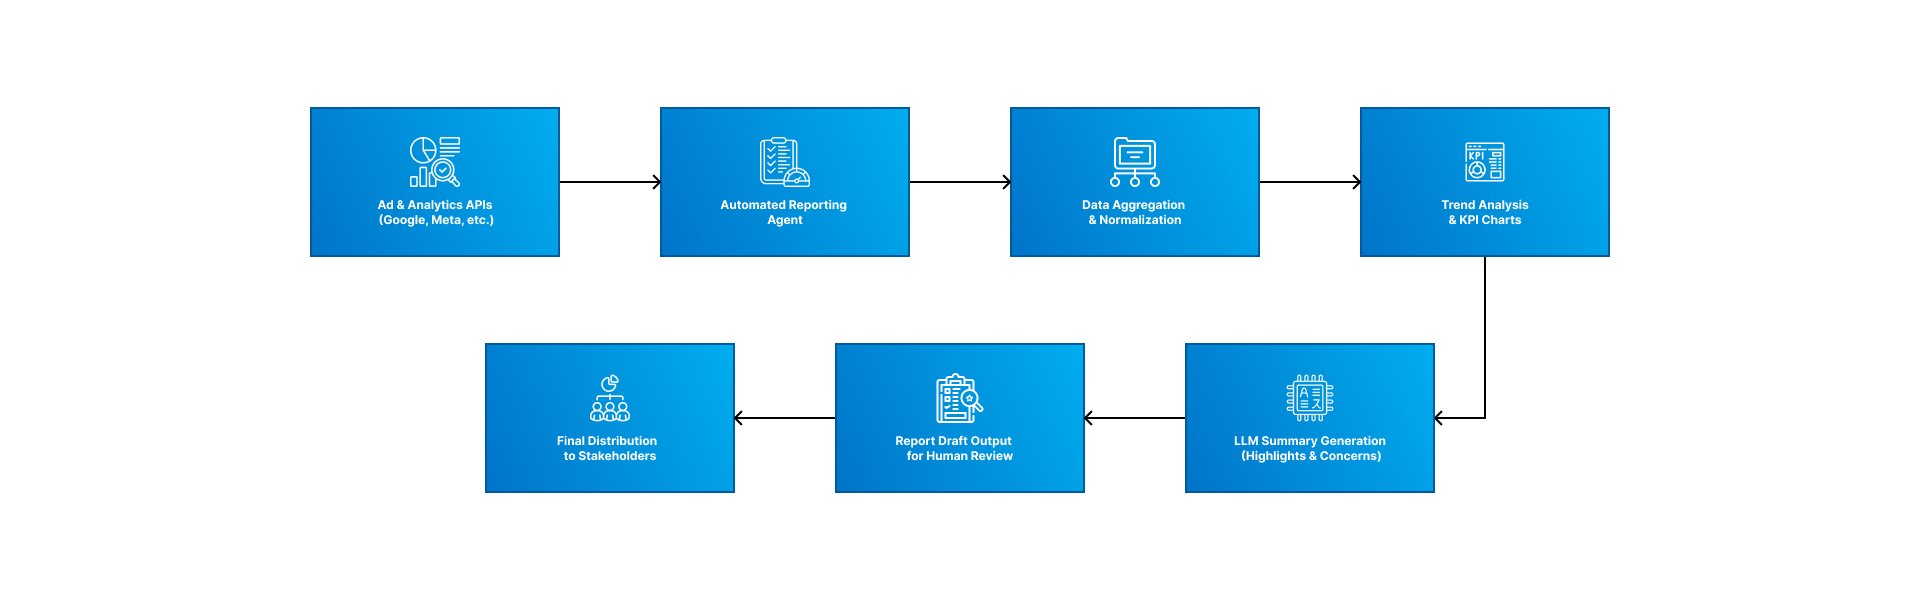
We created an Automated Reporting Agent that connects directly to analytics and advertising platforms via API to generate performance summaries autonomously.
- Data Integration: Pulled real-time metrics — spend, impressions, CTR, conversions — across all campaigns and normalized them into a consistent data model.
- Trend & Anomaly Detection: Compared week-over-week changes, highlighting statistically relevant gains or losses.
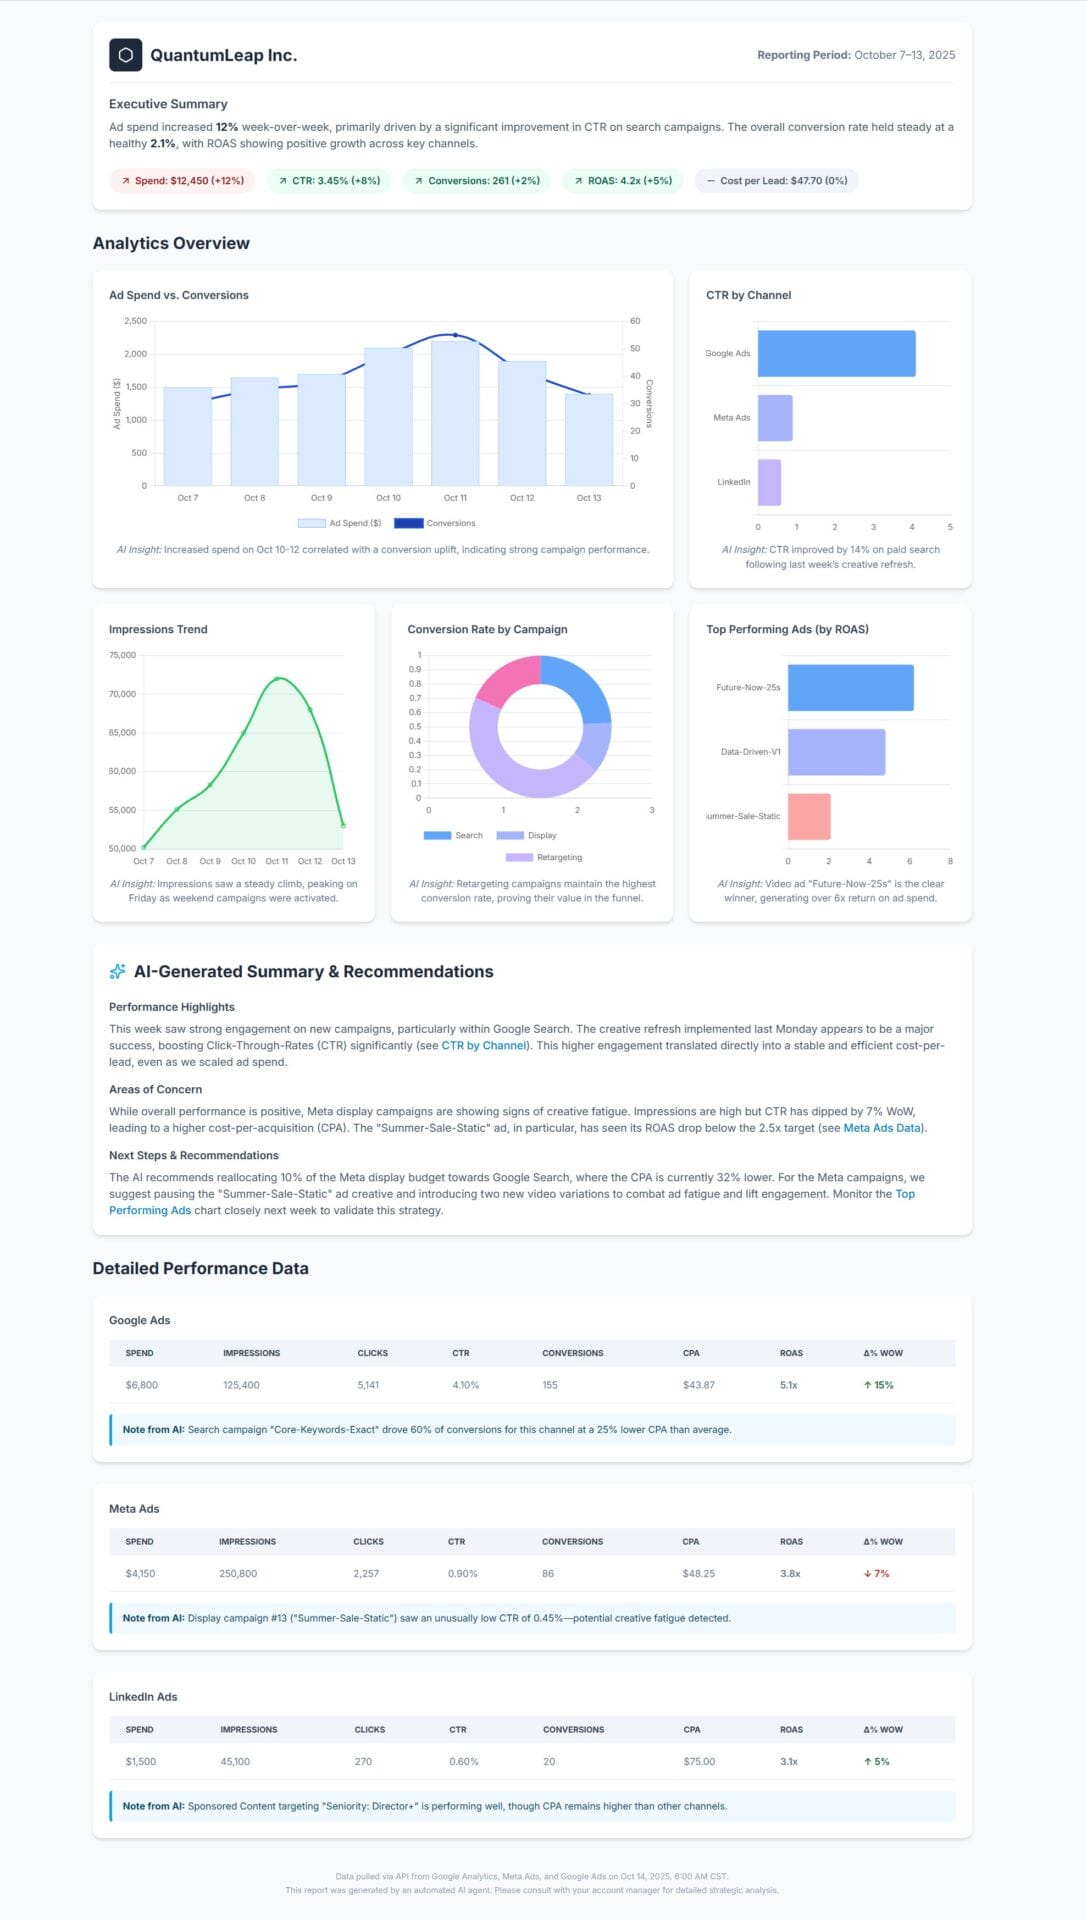
- Visual Summaries: Generated concise charts for key KPIs and performance shifts.
- Natural-Language Analysis: Using GPT-5 for interpretation and narrative synthesis, the agent wrote human-readable performance summaries and identified potential areas of concern or opportunity.
- Automated Delivery: The summaries were compiled into pre-formatted update drafts, routed directly to the marketing team for quick review and personalized commentary before distribution.
We evaluated standard solutions such as Looker Studio, Supermetrics, and third-party reporting dashboards. While these tools helped visualize data, none could interpret it or produce consistent written summaries at scale.
To bridge that gap — and avoid hiring additional analysts — we built a unified agent that both understands and communicates performance data.
The Challenges We Faced
The first challenge was data normalization across platforms. Metrics like conversions, reach, and CTR are defined differently between systems, so the agent required a harmonized model to produce fair comparisons.
Next came narrative precision. Early versions of the system tended to over-explain or infer causality inaccurately (“CTR dropped because audience fatigue”). We fine-tuned prompt logic and layered contextual validation to ensure all statements stayed factual and balanced.
Finally, security and access control were critical. Managing API credentials and permissions across dozens of brand accounts demanded a secure, scalable architecture with encrypted token storage and restricted access roles.
The Outcome
- 90% Time Reduction: Weekly performance reports generated automatically, freeing managers to focus on insights, not data pulling.
- Consistent Accuracy: Automated metric pulls eliminated copy-paste and formula errors.
- Actionable Insights: Every report included narrative summaries, not just raw data — enhancing executive understanding and decision-making.
- Scalable Process: One analyst now oversees what previously required an entire reporting team.
Before: Managers spent 6–8 hours per week compiling reports for 10 brands.
After: Reports for 70+ brands were generated and reviewed in under an hour.
The marketing department now operates on a fully automated Monday reporting cycle — turning what was once a manual data chore into a scalable, insight-driven process that deepens client confidence and saves hundreds of hours monthly.

Creating a vendor feedback platform to enable vendors and suppliers to exchange feedback and gain insights into working relationships for Abbott.

Empowering the US Chamber of Commerce with a versatile white label portal, an intuitive financial dashboard, and a custom API for seamless data integration.

Developing a lightning-fast, fuzzy search solution for a Sharepoint-integrated Angular JS app.

Empowering an Industry Leader with Email Migration and Security Enhancement

Enhancing customer support for an online charity auction platform with integrated CRM, sentiment analysis, and streamlined communication channels.

Creating a bespoke, personalized website for a leading weight loss clinic, emphasizing individualized care and secure communication of sensitive medical information.

Building a first of it’s kind procurement feedback platform for Diversity Suppliers / Buyers.

Overhaul of search and tagging structure using NLP, translated into 4 languages

Developing a custom dashboard with seamless AI integrations and API connections to empower SMB owners with enhanced performance visibility and streamlined data management.

Empowering Hoodle with strategic marketing support to implement ClickFunnels effectively and offering design mockups to breathe new life into their website


The Italian Trade Agency works alongside Italian companies to ensure them the greatest success on international markets and to encourage foreign companies to look to Italy as a reliable global partner.

Empowering a law firm through a website overhaul, Google Analytics strategy and implementation, and targeted PPC campaigns.

Silgan Closures manufacture Plastic bottle caps.


